Sea fisheries

Sea fisheries include all commercial fishing activity within inshore waters such as trawling, dredging, pots/creeling, and diving.

Historically, commercial fishing in the Solway Firth was relatively diverse with Dover sole and herring being the primary catches. However, in recent decades, catches have been almost exclusively shellfish, in particular scallops and queen scallops, with a small number of whelks, razor clams, lobsters and brown shrimp.

There is also a rare form of fishing only practiced in the Solway Firth called Haaf netting. Believed to have been passed down from Viking origins beginning in 900AD, haaf netting is a form of fishing for sea trout and salmon. This form of fishing involves fishermen wading into the dangerously shifting sands of the Solway and holding a net, akin to a football goal with an additional pole down the centre of the rectangular frame, into the sand to catch fish in the ebb or flood tide, angling the net when fish swim into the net in order to capture them. This traditional form of fishing is practiced on both sides of the Solway, and takes a great deal of skill in order to navigate the shifting sands, currents, and other dangerous of the Firth. These are often skills passed down through families, but numbers of haaf net fishermen have been reducing in recent years and concerns are growing that the method will fall out of use entirely. Haaf netting has been the focus of documentaries and museum exhibitions in recent years in attempts to help spread awareness of the fishing method and maintaining this 1,000 year old fishing method which is deeply engrained in the culture of the Solway.


As mentioned in the overview for the Productive chapter introduction of the Solway Review, this section is populated with data and information from the Socio-economic Assessment’s for the Scottish (SEASS), and English Solway (SEAES), which are two separate projects completed in 2020. Text below will be predominantly directly from the SEASS or SEAES Reports but is altered at times. These reports are available here. These socio-economic reports were needed in light of the changing face of socio-economic aspects impacting the Solway Firth, and also for the purpose of populating the productive section of the Solway Review. Text from the SEASS and SEAES reports is not referenced individually.


Image; Oyster Fishing. © Solway Firth Partnership. Photographer; Colin Tennant.

Sea fisheries

Scotland - Summary

Fishing by the Solway fleet is primarily undertaken by scallop dredgers a combination of smaller local vessels and larger more nomadic dredgers. These are complimented by a smaller creel fishing boats catching lobsters, crabs, etc. Traditional haaf net fishing for salmon and trout also takes place around the Firth, however this has become a recreational/ heritage industry in recent years.

Kirkcudbright is the main landing port in Dumfries & Galloway, accounting for 72% of all landings by weight in 2018, including 65% of scallops and 98% of queen scallops.

The weight of landings are down considerably in recent years, with a reduction of -76% from the 2011 peak, primarily due to a significant decline in the queen scallop (-87%) and (-32%) in the scallop catches. This is primarily driven by fall in local scallop stocks. Total value of the catch has also decreased, but only by -19%, indicating a considerable increase in shellfish prices over this period driven by (national and international) demand which is outstripping supply.

There is no commercial harvesting of mussels in the Scottish Solway.

There are a number of management measures in the Scottish Solway such as the prohibition of fishing for sea fish with mobile or active gear (such as dredge and bottom/midwater trawl fishing) in Loch Ryan (The Inshore Fishing (Prohibition of Fishing and Fishing Methods) (Scotland) Order 2004). For the most up-to-date restrictions on fishing throughout the UK visit the Kingfisher Information Service here.

In Wigtown and Luce Bay there is a Solway Code of Conduct between scallop and static gear fishermen, intended to support good working arrangements for both the mobile and static fishing sectors. This Code of Conduct has been developed by local fishermen, businesses and related organisations. Scalloping by mechanical dredge trawlers is banned within the Luce Bay and Sands Special Area of Conservation, except for three outlined areas for four months of the year. These rules are outlined in the Inshore Fishing (Prohibited Methods of Fishing) (Luce Bay) Order 2015.


Defining the Sector

The economic contribution of the sea fisheries sector is measured through the Standard Industrial Classification (SIC) code (Office for National Statistics, 2007): 03.11: Marine Fishing.

A summary of the changes across economic indicators (2014 to 2018) is presented in the table below.

Change in Activity, 2014 – 2018

Indicator

Change

Employment

-25%

Turnover*

-11%

GVA*

+1%

Tonnage of landings

-50%

Value of landings

+4%

* 2014 to 2017 and adjusted to 2017 prices


Image; Kirkcudbright. © Solway Firth Partnership. Photographer; Kim Ayres

Sea fisheries

Scotland - Contribution to the Economy


Employment

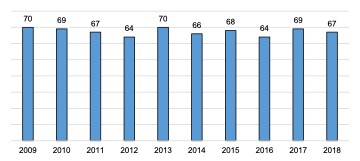
Sea fisheries employment has been on a downward trend over the last decade, with a 25% reduction since 2014 and a 44% reduction since 2009, see figure belowScottish Solway: Employment, 2009 – 2018′.

Scottish Solway: Employment, 2009 - 2018

Scottish Solway: Employment, 2009 – 2018. (Source: Office for National Statistics (Various) (BRES))


It is worth noting that this data is from the official source of the Business Register and Employment Survey (BRES), however it is understood that the region has many more fishermen than displayed through this data. It may be that some fishermen are employed elsewhere or other factors mean they are not included in this data.

The number of fishers working on Scottish Registered vessels in Dumfries and Galloway is 274 according to the Scottish Sea Fisheries Statistics 2018. However, the comparison of BRES employment numbers to Scottish Sea Fisheries Statistics recording of fishers working on Scottish registered vessels has disparity for other areas as well. For example these numbers are 100 in BRES compared to 291 for 2018 respectively in Orkney. This data refers to ‘fishers’ not specifically those employed in Dumfries and Galloway, so the perception of employed fishermen is much higher than those officially recorded by BRES as in employment in SIC 0311 in Dumfries and Galloway.

Location Quotients (LQ) provide information on the representation of marine industry sectors in Dumfries & Galloway in comparison with Scotland. The LQ compares the industry’s share of regional employment with its share of national employment – an LQ greater than one indicates a greater concentration of sector employment than Scotland as a whole, whilst an LQ lower than one indicates a lesser concentration.

The LQ of the fishing industry in Dumfries & Galloway has declined over time as employment has declined, in parallel employment in Scotland has increased (+38% since 2009), see figure below, ‘Scottish Solway: Sea Fisheries Location Quotients, 2009 – 2018’.

What this means is that sea fisheries significance as an employer (relative to Scotland) has decreased. Nevertheless, that is not to say that its importance as a sector and employer has decreased – it is often the ‘backbone’ and supports the livelihood of local residents in many small rural communities within the Solway.

Scottish Solway: Sea Fisheries Location Quotients, 2009 - 2018

Scottish Solway: Sea Fisheries Location Quotients, 2009 – 2018. (Source: Office for National Statistics (Various) (BRES))


Economic Output – Turnover and GVA

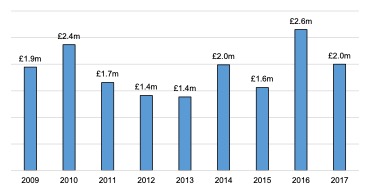
Both turnover and GVA have been relatively flat with a peak in 2016 due to a spike in the value of the catch (as discussed below). This trend may seem odd given the fall in the level of employment, but this is reflective of increase in the price of fish, and therefore increased turnover and profitability. The notable increase in 2016 was driven by a 15% increase in the average price of Scallops, from £2,098 per tonne to £2,411 per tonne (Marine Scotland, 2017b). See Figures below, ‘Scottish Solway: Sea Fisheries Turnover, 2009 – 2017’ and ‘Scottish Solway: Sea Fisheries GVA, 2009 – 2017’.

Scottish Solway: Sea Fisheries Turnover, 2009 - 2017

Scottish Solway: Sea Fisheries Turnover, 2009 – 2017. (Source: Scottish Government (2019) (SABS))


Scottish Solway: Sea Fisheries GVA, 2009 - 2017

Scottish Solway: Sea Fisheries GVA, 2009 – 2017. (Source: Scottish Government (2019) (SABS))


The GVA to turnover ratio provides an insight into the relative levels of productivity with the sector. The ratio declined from 2011, likely as a result of cost pressures on the industry such as increased fuel costs. However, productivity has increased from 2015 onwards, likely due to a) the decline in employment (reduced costs) and b) the increase in value of the catch over this period (increase in price), see figure below, ‘Scottish Solway: Sea Fisheries GVA to Turnover Ratio, 2009 – 2017’.

Scottish Solway: Sea Fisheries GVA to Turnover Ratio, 2009 - 2017

Scottish Solway: Sea Fisheries GVA to Turnover Ratio, 2009 – 2017. (Source: Scottish Government (2019) (SABS))


The table below, ‘Scottish Solway: Tonnage Landed by Selected Species, 2009 – 2018’, shows the landings of the main species of shellfish and total landings. Data for individual demersal and pelagic species are not shown due to data suppression. A total of 2,416 tonnes of sea fish and shellfish was landed in 2018. Almost the entire catch (99.6%) was shellfish, with queen scallops and scallops by far the most important species, accounting for 49% and 34% of total landings, respectively. There has been a large decline in the tonnage of landings in recent years, with a -50% decline since 2014, and a -76% decline since the 2011 peak. Consultees reported that this is largely due to increased competition over the scallop grounds in the Irish Sea, particularly with the Isle of Man, and a general decline in scallop stocks. This has forced much of the Scottish Solway scallop fleet to fish outwith the Irish Sea, primarily in the English Channel.

Scottish Solway: Tonnage Landed by Selected Species, 2009 – 2018

2009

2010

2011

2012

2013

2014

2015

2016

2017

2018

Change since 2014

% change since 2014

Queen

Scallops

3,713

6,741

8,859

7,019

5,252

3,034

3,343

2,542

1,541

1,173

-1,860

-61%

Scallops

1,382

1,522

1,216

1,170

1,020

1,371

856

1,404

822

831

-540

-39%

Whelks

106

119

110

140

193

263

241

300

336

307

+44

+17%

Razor Clam

30

0

4

65

146

88

169

251

174

40

-48

-54%

Lobsters

47

62

51

46

43

40

50

62

45

39

-1

-4%

Crabs

11

8

7

6

5

4

4

4

5

21

+18

+466%

Nephrops

45

52

18

4

18

18

20

18

15

3

-15

-84%

Shellfish

Total

5,341

8,846

10,265

8,450

6,678

4,817

4,683

4,582

2,937

2,415

-2,402

-50%

Demersal

Total

3

9

2

2

3

3

1

2

4

1

-2

-75%

Pelagic

Total

2

1

1

1

3

2

1

0

0

0

-2

-87%

Total

5,346

8,857

10,267

8,453

6,684

4,823

4,686

4,584

2,941

2,416

-2,407

-50%

Source: Marine Scotland (n.d.).


The table below, ‘Scottish Solway: Value Landed by Species, 2009 – 2018’, shows the value of landings of the main species of shellfish and total landings. Despite the -50% fall in the total catch (tonnage) since 2014, the total value of the catch has increased by +4% within the same period, indicating a strong rise in the price of shellfish. As noted above, between 2015 and 2016, the average price per tonne for Scallops increased by +15% over the course of one year (driven by an increase in demand and decline in the supply).

Scottish Solway: Value Landed by Species, 2009 – 2018
2009 2010 2011 2012 2013 2014 2015 2016 2017 2018 Change since 2014 % Change since 2014
Scallops £2.7m £2.6m £2.4m £2.3m £2m £2.7m £1.9m £3.7m £2.4m £2.5m -£206k -8%
Queen Scallops £1.6m £2.6m £3.6m £2.9m £3m £1.4m £1.9m £2.1m £1.9m £1.5m +£94k +7%
Lobsters £506k £649k £546k £495k £434k £404k £504k £717k £624k £584k +£179k +44%
Whelks £58k £61k £63k £84k £127k £215k £195k £287k £367k £361k +£146k +68%
Razor Clam £82k £* £14k £196k £452k £331k £771k £1.2m £1.1m £324k -£10k -2%
Crabs £12k £* £* £* £* £* £* £* £* £62k +£57k +1,357%
Nephrops £95k £98k £39k £* £38k £43k £38k £42k £34k £* -£34k -79%
Shellfish Total £5.1m £6.4m £6.6m £6m £6.1m £5.1m £5.3m £8.1m £6.2m £5.4m +£230k +4%
Demersal Total £12k £19k £* £* £16k £16k £* £* £34k £* n/a
Pelagic Total £* £* £* £* £* £* £* £* £* £* n/a
Total £5.1m £6.4m £6.6m £6m £6.1m £5.1m £5.3m £8.1m £6.2m £5.4m +£218k +4%

Source: Marine Scotland (n.d.).     Note: Values below £10,000 are suppressed


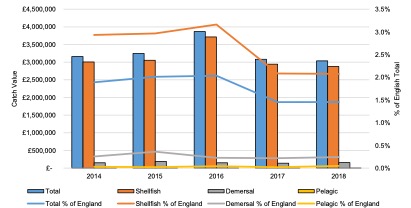
Across Scotland, overall landings were down -6% from 2014. Despite this decline in landings, values rose by 16% due to the rising price of fish. Shellfish has seen a -16% decline in landings since 2014 and 9% increase in catch value (Marine Scotland, 2019). See figures below,  ‘Tonnage: Scottish Solway as a % of Scotland, 2009 – 2018’ and ‘Value: Scottish Solway as a % of Scotland, 2009 – 2018’.

As a percentage of the total landings, the Scottish Solway is a fairly minor contributor to the Scottish fishing industry, accounting for 0.9% of the tonnage and 1.3% of the value in 2018. However, in terms of individual species, Dumfries & Galloway accounted for 96% of queen scallops, 12% of scallops and 21% of whelks landed in Scotland (by weight).

Kirkcudbright is the largest scallop landing port by tonnage and the second largest by value in Scotland. However, it should be noted that Kirkcudbright’s scallop fleet is ‘nomadic’, meaning that it does not necessarily fish in the Solway Firth (or the Irish Sea to the west). The Kirkcudbright fishing fleet is primarily active in the English Channel with some activity in the Irish Sea, and are known to fish up the North East coast of Scotland, although landings still take place in Kirkcudbright. Interestingly, mainly boats registered on the Isle of Man fish in the Solway Firth.

Tonnage: Scottish Solway as a % of Scotland, 2009 - 2018

Tonnage: Scottish Solway as a % of Scotland, 2009 – 2018. (Source: Marine Scotland, n.d.)


Value: Scottish Solway as a % of Scotland, 2009 - 2018

Value: Scottish Solway as a % of Scotland, 2009 – 2018. (Source: Marine Scotland, n.d.)


In 2018, the level of all fish and shellfish exports from Scotland were down -6% on the previous year and -19% since 2014. Further, the percentage of total production exported was down five percentage points since 2014.

There is limited data available for the export of fish (defined as “Fish (not marine mammals), crustaceans, molluscs and aquatic invertebrates and preparations thereof” by the United Nations Commodity Trade Statistics Database), and only for commercial fishing and aquaculture (combined) at the Scottish level. See table below, ‘Fish and Shellfish Exports (Tonnes) Scotland, 2014 – 2018’. It is likely that this data understates the amount of Scottish fish that is exported, as a proportion of Scottish fish production is used as an input by English based fish processors which is the exported, and is therefore classified as an export from England.

Fish and Shellfish Exports (Tonnes) Scotland, 2014 – 2018

Total Production

Tonnage Exported

% Exported

2014

479,360

219,176

46%

2015

439,016

175,008

40%

2016

453,278

186,981

41%

2017

474,141

188,732

40%

2018

439,431

178,050

41%

Source: Marine Scotland (n.d.), HMRC
Note: Combined commercial fishing and aquaculture


It is difficult to estimate the tonnage of shellfish exported from the Dumfries & Galloway from these figures. However, around 70% of the total UK scallop catch is exported (Cappell et al, 2013) and consultation evidence also indicated that a large proportion of Scallops production is exported, primarily to France.


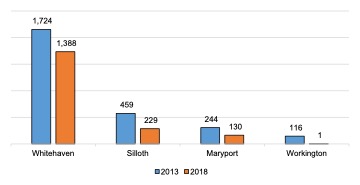
The map below presents a breakdown of the main landing ports in Dumfries & Galloway, with Kirkcudbright being by far the biggest and accounting for 72% of landings by tonnage.


Main Landing Port in Scottish Solway, 2018 map

Main Landing Port in Scottish Solway, 2018. (Source: Marine Scotland, n.d.)


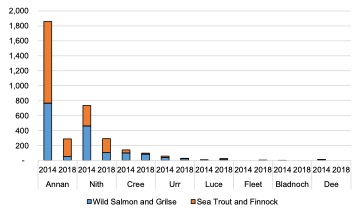
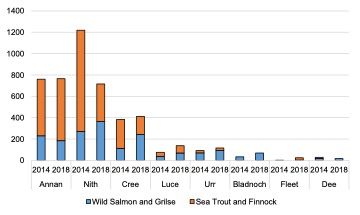
The figures below, ‘Scottish Solway: Landing weight (Tonnes) by Landing Port’ and ‘Scottish Solway: Landing Value by Landing Port’, show the change in catch weight and value since 2014 by landing port. Overall, reflecting trends across the sector the catch was considerably down in the largest ports, with tonnage reductions of -52% in Kirkcudbright, -41% in Stranraer and -63% in Isle of Whithorn. By contrast, the value of catch in the major ports has increased by +9% in Kirkcudbright, +28% in Stranraer and +5% in Isle of Whithorn, again highlighting that increased prices (in particular, shellfish) have offset the decline in the weight (tonnage) landed.

Scottish Solway: Landings Weight (Tonnes) by Landing Port

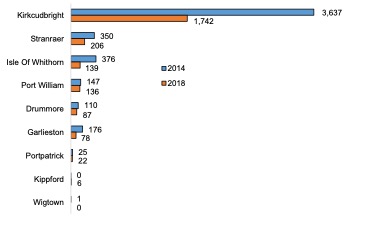
Scottish Solway: Landings Weight (Tonnes) by Landing Port. (Source: Marine Scotland, n.d.)


Scottish Solway: Landing Value by Landing Port

Scottish Solway: Landing Value by Landing Port. (Source: Marine Scotland, n.d.)

Sea fisheries

Scotland - Quotas, Regulation & Fishing Vessels


Quotas and Regulation

Scallops and queen scallops are not currently subject to European Union (EU) quotas and therefore little in the way of EU regulation relates to these species. However, there are EU Minimum Conservation Reference Sizes minimum catch sizes set for scallops of 100mm and queen scallops of 40mm. In most of Scottish waters the minimum size for scallops is increased to 105mm as per The Regulation of Scallop Fishing (Scotland) Order 2017. However, in the Solway minimum catch size for scallops is slightly larger, 110mm, given that in the Irish Sea south of 55°N the minimum catch size for scallops is 110mm. Both the general 105mm measurement and the increased 110 mm measurement are provided for in Article 3 of The Regulation of Scallop Fishing (Scotland) Order 2017.

Concerns over the health of the queen scallop stock have led to a re-assessment of these controls, with most consultees backing an increase in the minimum size and the introduction of a seasonal closure of the fishing grounds (Marine Scotland, 2017a). The seasonal closure was introduced in 2018, but as yet there has been no change in minimum catch size.

Various forms of fishing are restricted in certain parts of the Scottish Solway as per measures such as the Inshore Fishing (Prohibition of Fishing and Fishing Methods) (Scotland) Order 2004 and the Inshore Fishing (Prohibited Methods of Fishing) (Luce Bay) Order 2015, and the Scallops (Irish Sea) (Prohibition of Fishing) (Variation) Order 1986.


Fishing Boats

There are 67 fishing boats currently registered in Dumfries & Galloway, down -4% from 2009, but up +2% since 2014. Just under half (48%) of these vessels are registered at Kirkcudbright, with the rest spread across a number of other ports, see figures below, ‘Number of Vessels registered in Scottish Solway, 2009 – 2018’ and ‘Number of Vessels by Port in Scottish Solway, 2018’. It should be noted that not all boats registered in the region will fish within the Solway, as some will operate outside the Solway Firth, and some of the landings at ports and harbours in the Solway will be made by boats registered outwith the region.

Number of Vessels registered in Scottish Solway, 2009 - 2018

Number of Vessels registered in Scottish Solway, 2009 – 2018. (Source: Marine Scotland, n.d.)


Number of Vessels by Port in Scottish Solway, 2018

Number of Vessels by Port in Scottish Solway, 2018. (Source: Marine Scotland, n.d.)
Note: vessels can be registered at the port/ harbour that is nearest to their agent’s office – not necessarily where they operate or land.


Image; Boats on the Solway (Kirkcudbright). © Solway Firth Partnership. Photographer; Colin Tennant.

Sea fisheries

Scotland - Salmon and Trout Fishing

Salmon and trout fishing in Dumfries & Galloway has experienced a steep decline in recent years, with the total number caught down by -74% since 2014 and total weight down by -76%. The decline has been even more pronounced if we consider the last ten years, with total numbers caught down by -88% and weight by -91%. This fall in catch is due to falling fish stocks and restrictions on catch numbers, see table below ‘Scottish Solway: Salmon and Trout Caught and Retained’.

Scottish Solway: Salmon and Trout Caught and Retained

2009

2010

2011

2012

2013

2014

2015

2016

2017

2018

Change since 2014

% change since 2014

Wild Salmon Number

2,246

2,178

2,461

1,655

1,205

740

696

33

189

166

-574

-78%

Wild Salmon Weight (kg)

9,758

9,133

11,429

7,500

5,194

3,327

3,105

179

803

724

-2,603

-78%

Wild Grilse Number

1,543

2,557

1,319

1,254

935

642

682

7

125

111

-531

-83%

Wild Grilse Weight (kg)

3,629

5,798

3,038

2,843

2,300

1,480

1,487

15

286

262

-1,219

-82%

Sea Trout Number

2,050

1,636

1,268

1,520

1,733

1,349

1,082

823

530

435

-914

-68%

Sea Trout Weight (kg)

2,860

1,902

1,370

2,279

1,801

1,373

1,135

974

593

508

-865

-63%

Finnock Number

29

15

34

24

121

79

89

18

16

20

-59

-75%

Finnock Weight (kg)

11.5

6.6

13.6

10.7

42.4

35.4

28.5

6.9

4.9

6.4

-29

-82%

Total Number

5,868

6,386

5,082

4,453

3,994

2,810

2,549

881

860

732

-2,078

-74%

Total Weight (kg)

16,258

16,839

15,852

12,632

9,337

6,215

5,755

1,175

1,687

1,500

-4,715

-76%

Source: Marine Scotland (n.d.).


Total number caught and released has had a comparatively modest reduction, with numbers caught since 2014 down -13%, but weight up 8%. As a recreational activity, this has not been affected by catch restrictions, see table below, ‘Scottish Solway: Salmon and Trout Caught and Released’.

Scottish Solway: Salmon and Trout Caught and Released

2009

2010

2011

2012

2013

2014

2015

2016

2017

2018

Change since 2014

% change since 2014

Wild Salmon Number

1,045

1,295

1,599

1,126

906

558

775

890

1,192

622

+64

+11%

Wild Salmon Weight (kg)

4,297

5,280

7,180

4,800

4,066

2,307

3,314

3,825

5,240

2,565

+258

+11%

Wild Grilse Number

390

715

441

576

418

217

367

488

491

419

+202

+93%

Wild Grilse Weight (kg)

843

1,561

979

1,281

902

488

818

1,027

1,110

939

+451

+92%

Sea Trout Number

907

796

674

1,107

994

1,553

1,232

1,192

1,397

804

-749

-48%

Sea Trout Weight (kg)

938

757

661

1,094

903

1,329

1,209

1,184

1,417

866

-463

-35%

Finnock Number

79

97

58

46

366

266

162

238

279

410

+144

+54%

Finnock Weight (kg)

28

38

17

17

97

83

55

62

114

156

+73

+89%

Total Number

2,421

2,903

2,772

2,855

2,684

2,594

2,536

2,808

3,359

2,255

-339

-13%

Total Weight (kg)

6,106

7,637

8,837

7,191

5,968

4,207

5,396

6,098

7,880

4,525

+318

+8%

Source: Marine Scotland (n.d.).


The figure below,‘Scottish Solway: Retained Trout and Salmon by District’, outlines the numbers of wild salmon and sea trout caught and retained in Dumfries & Galloway by District, with particularly steep declines in Annan. Very few salmon or trout are caught in Luce, Fleet, Bladnoch or Dee.

Scottish Solway: Retained Trout and Salmon by District

Scottish Solway: Retained Trout and Salmon by District. (Source: Source: Marine Scotland, n.d).


The figure below, ‘Scottish Solway- Released Trout and Salmon by District’, outlines the numbers of wild salmon and sea trout caught and released in Dumfries & Galloway by District, with broadly no change except a decline in the Nith.

Scottish Solway- Released Trout and Salmon by District

Scottish Solway- Released Trout and Salmon by District. (Source: Source: Marine Scotland, n.d).


The figure below, ‘Scottish Solway: Trout and Salmon Caught by Method’, outlines the numbers of wild salmon and sea trout caught in Dumfries & Galloway by method, with declines in both fixed engine and rod (retained).

Scottish Solway: Trout and Salmon Caught by Method

Scottish Solway: Trout and Salmon Caught by Method. (Source: Source: Marine Scotland, n.d).


Consultation evidence indicates that this decline in the catch is a result of an overall decline in salmon stocks and subsequent implementation of conservation measures which limit the number of fish allowed to be caught. The reason behind the decline in salmon stocks in unclear at this stage.

The decline in the fixed engine catch, primarily haaf net fishing, is particularly concerning as this was formerly a viable – albeit small scale, traditional commercial fishery which dates back hundreds of years in the Solway. Haaf net fishing in the Solway at present is a recreational, heritage, and conservation industry rather than a commercial concern. Haaf netters are able to retain sea trout and other fish but must return any salmon caught. In 2016, Scotland brought in the The Conservation of Salmon (Scotland) Regulations 2016, prohibiting the retention of salmon caught in nets within inshore waters. Salmon can only be killed when defined conservation targets have been met, otherwise they must caught and released. The most recent Scottish river grades for the salmon conservation regulations are available here.

Stake net fishing leases near the River Annan were terminated by Dumfries and Galloway Council in 2015 amid concerning stock declines and salmon interception (BBC, 2015).


Sea fisheries

Scotland - Cockle Fisheries

Cockle fisheries in the Scottish Solway Firth were closed in 2011 under the Inshore Fishing (Prohibition of Fishing for Cockles) (Solway Firth) (Scotland) Order 2011, following a five-year Solway Firth Regulating Order (2006-2011) managed by the Solway Shellfish Management Association (dissolved 2017). This closure was due to concerns over the sustainability of the species in the region, having been commercially harvested since 1987.

Stakeholders agree that there is a potential opportunity to reopen the cockle fishery. However, a 2014 study (The Solway Cockle Fishery Management Study) identified challenges due the inconsistent quality of the cockles and restricted demand (Marine Scotland Science, 2015).

In 2016 the Scottish Government reported that a study had found “no large concentrations of mature stocks and the numbers of juvenile cockles are also very low and unlikely to produce meaningful mature stocks in the near future”. The cockle grounds were therefore to remain closed and a further study to take place in “a couple of years” (Scottish Government, 2016).

Between 2016 – 2019, The West Coast Regional Inshore Fisheries Group (WCRIFG), together with Marine Scotland, collaborated with cockle fisheries’ representatives to explore opportunities for conducting an industry-led cockles hand gathering trial that would build on the findings of the 2014 study. Subject to meeting certain criteria, Marine Scotland indicated it would support a trial led by industry that would allow some commercial harvesting to occur but, which would be accompanied by evidence gathering. Aimed at identifying a sustainable cockle fisheries management strategy that could see commercial gathering return to the Scottish side of the Solway, industry representatives have an opportunity to propose a plan which may enable a trial to proceed.

More recently, Glasgow University has received funding from the Seafood Innovation Fund to conduct a research trial re-laying cockles in the Firth. A feasibility study will begin in 2020 which will explore opportunities to re-lay or transplant Solway cockles into areas which are currently devoid of the shellfish but where the species historically colonised. The aim is to test the viability of re-laying as a potential method of repopulating cockle beds and, if successful, it could have a positive impact on the sustainability of cockles as well as future commercial harvesting opportunities (BBC News, 2020).


Image; Cockle Shell. © N. Coombey/ Solway Firth Partnership

Sea fisheries

Scotland - Pressures and Impacts

An assessment of the socio-economic and environmental pressures and impacts of human activity is provided below.

Socio-Economic
Positive Negative
•   Supports rural economy – retaining jobs and people

•   Contributes to key sector growth

•   Lack of linkages with local supply chains

•   Visual impact on coastal locations


Environmental
Pressure theme Pressure Impact
Habitat damage Habitat damage Subsea infrastructure has the potential to damage the seabed
Habitat damage Dredging for scallops has the potential to harm the seabed
Pollution and chemical Introduction of hazardous substances Potential adverse environmental impact from introducing chemicals into the marine environment
Munitions Dumping at Beauforts Dyke Extensive dumping of wartime munitions at Beauforts Dyke, including chemical weapons, has the potential to contaminate marine wildlife and for dredging to disturb munitions.
Other physical Litter and discarded net, cages, pots, etc There is a general environmental risk to fish and other marine species from discarded nets and litter.
Biological Introduction of INNS Organisms present in ballast water and living on ship hulls are just two of many ‘pathways’ by which marine Invasive Non-Native Species can be introduced
Bycatch Certain fishing methods run the risk of harming non-targeted fish and shellfish species, marine mammals and seabirds through bycatch

Sea fisheries

Scotland - Regional Look Forward

The fishing industry is a small part of the Scottish Solway Coast economy, employing relatively few people and contributing only a small part of regional GVA. However, it is an important part of Scotland’s scallop fishing industry, catching 96% of queen scallop and 12% of scallops caught in Scotland in 2018.

There are some concerns about the health of the local scallop, queen scallop and salmon stocks, although there is currently a lack of scientific data to identify reasons for this. The total catch in all three of these species is down considerably in recent years, due to this and further restrictions of catches to address falling stock. In the case of scallops and queen scallops, rising prices have cushioned this fall in catch, however, salmon fishing in the Solway has become a recreational and heritage industry rather than a commercial concern.

Brexit is reported to be a major concern for the main scallop exporters in the region with the potential for trade barriers and/or customs checks, which would make exporting logistically more challenging and costly. Other concerns include uncertainty on the:

  • value of the pound making exporting less predictable;
  • future trading relations with the EU and rest of the world once the UK is no longer subject to EU negotiated trade deals;
  • access to important EU fishing grounds, in particular in the English Channel; and
  • future quotas and regulation, and whether responsibility over fisheries will rest at the Scottish or UK level.


Image; Lobster Creel. © Solway Firth Partnership. Photographer; Colin Tennant.

Sea fisheries

England - Summary

Whitehaven is the main landing port on the English Solway Coast, accounting for 79% of all landings by weight in 2018 and 70% by value.

Landings are down in recent years, with a reduction of 31% since 2013, primarily due to a fall in the scallop, queen scallop and nephrop catch. Total value of the catch has also decreased, but only by 19%, and indicates an increase in shellfish prices over this period.

It is worth noting that mussels are common along the Cumbria Solway Coast. The English Solway mussel bed currently has a limited stock available and mussels can be landed if above the Minimum Landing Size of 45mm. Refer to the North Western Inshore Fisheries and Conservation Authority (NWIFCA) website for further information. Insufficient data from sampling of landings means that analytical stock assessments have not been undertaken for the Solway Firth region.

There are a number of management measures in the English Solway such as NWIFCA byelaws 3, 6, 13, 14, 15 and the Restrictions on Use of a Dredge Byelaw. For more information on these byelaws, the areas they cover and the most up-to-date restrictions on fishing throughout the UK visit the Kingfisher Information Service here.

Defining the Sector

The economic contribution of the sea fisheries sector is measured through the Standard Industrial Classification (SIC) code (Office for National Statistics, 2007): 03.11: Marine Fishing.

Change in Activity, 2014 – 2018

Indicator

Change

Employment

+133%

Turnover

-34%

GVA

-33%

Tonnage of landings*

-31%

Value of landings*

-17%

*2013 – 2018 figures and adjusted to 2018 prices


Image; Fishing on the Solway (Smokehouse Fishing in Scotland). © Solway Firth Partnership. Photographer; Colin Tennant.

Sea fisheries

England - Contribution to the Economy


Employment

Marine fishing employment is slightly up over the last decade, with a 17% increase since 2009 and a 133% increase since 2014, see figure below, ‘English Solway: Sea Fisheries Employment 2009-2018’.

English Solway Firth: Sea Fisheries Employment, 2009 - 2018

English Solway: Sea Fisheries Employment, 2009 – 2018. (Source: Office for National Statistics (Various) (BRES))


Location Quotients (LQs) provide information on the representation of marine industry sectors in the English Solway Coast in comparison with England. The LQ comparesthe industry’s share of regional employment with its share of national employment – an LQ greater than one indicates a greater concentration of sector employment than England as a whole, whilst an LQ lower than one indicates a lesser concentration.

The LQ of the marine fishing industry on the English Solway Coast is very high and has fluctuated over time. However, this high LQ is more reflective of the low level of marine fishing employment in England, rather than any particular strength of the English Solway marine fishing industry, see figure below, ‘English Solway: Sea Fishing Location Quotients, 2009 – 2018’.

Sea Fishing Location Quotients, 2009 - 2018

English Solway: Sea Fishing Location Quotients, 2009 – 2018. (Source: Office for National Statistics (Various) (BRES))


Economic Output – Turnover and GVA

Both turnover and GVA have been broadly stable over the last decade, albeit with some year to year variations, see figures below, ‘English Solway- Sea Fisheries Turnover, 2009 – 2018’ and ‘English Solway: Sea Fisheries GVA, 2009 – 2018’.

English Solway- Sea Fisheries Turnover, 2009 - 2018

English Solway- Sea Fisheries Turnover, 2009 – 2018. (Source: Office for National Statistics (Various) (ABS))


English Solway: Sea Fisheries GVA, 2009 - 2018

English Solway: Sea Fisheries GVA, 2009 – 2018. (Source: Office for National Statistics (Various) (ABS))


The GVA to turnover ratio provides an insight into the relative levels of productivity within the sector. The ratio declined from 2009, likely as a result of cost pressures on the industry such as increased fuel costs. However, productivity has increased from 2015 onwards, likely due to the increase in value of the catch (i.e. increase in price), see figure below, ‘English Solway: Sea Fisheries GVA to Turnover Ratio, 2009 – 2018’.

English Solway: Sea Fisheries GVA to Turnover Ratio, 2009 - 2018

English Solway: Sea Fisheries GVA to Turnover Ratio, 2009 – 2018. (Source: Office for National Statistics (Various) (ABS))


Image; The side of a fishing vessel. © Solway Firth Partnership. Photographer; Colin Tennant

Sea fisheries

England - Other Activity Measures

The table below shows the landings by selected species of shellfish, fish and total landings. A total of 1,748 Tonnes of sea fish and shellfish were landed in 2018. The vast majority (91%) was shellfish, with whelks accounting for 58% of total landings. There has been a large decline in landings in recent years, with a 31% decline since 2013, although whelk landings have bucked this trend with a 47% increase.

English Solway: Tonnage Landed by Selected Species, 2013 – 2018

2013

2014

2015

2016

2017

2018

Change since 2013

% Change since 2013

Whelks

694

655

792

935

1,099

1,019

+325

+47%

Scallops

835

373

579

659

342

312

-523

-63%

Nephrops

457

538

190

126

114

132

-325

-71%

Thornback ray

123

75

117

61

49

63

-60

-49%

Crabs

0

0

0

0

1

57

+57

n/a

Queen scallops

265

492

925

753

107

51

-213

-81%

Plaice

52

18

28

21

34

38

-14

-26%

Shellfish Total

2,284

2,074

2,489

2,507

1,721

1,595

-689

-30%

Demersal Total

255

143

232

164

126

152

-102

-40%

Pelagic Total

3

0

0

0

1

1

-3

-78%

Total

2,542

2,217

2,721

2,671

1,847

1,748

-794

-31%

Source: Marine Management Organisation (n.d.)


The table below shows the value of landings by selected species of shellfish, fish and total landings. Despite the 31% fall in the total landings since 2013, the total value of the catch only decreased by 19%, due to a rise in the price of shellfish.

English Solway: Value Landed by Selected Species, 2013 – 2018


2013

2014

2015

2016

2017

2018

Change since 2013

% Change since 2013

Whelks

£567k

£621km

£706km

£877k

£1.1m

£1.3m

+£714k

+128%

Scallops

£1.6m

£781k

£1.3m

£1.8m

£1m

£806k

-£787k

-49%

Nephrops

£1.1m

£1.3m

£483k

£339k

£335k

£415k

-£681k

-62%

Lobsters

£29k

£31k

£31k

£46k

£46k

£134k

+£105k

+369%

Brown shrimps

£95k

£37k

£*

£176k

£306k

£106k

+£11k

+12%

Crabs

£*

£*

£*

£*

£*

£82k

+£82k

n/a

Queen scallops

£112k

£207k

£494k

£504k

£94k

£64k

-£48k

-43%

Shellfish Total

£3.5m

£3m

£3.1m

£3.7m

£2.9m

£2.9m

-£603k

-17%

Demersal Total

£279k

£150k

£190k

£150k

£138k

£155k

-£124k

-44%

Pelagic Total

£*

£*

£*

£*

£*

£*

n/a

Total

£3.8m

£3.2m

£3.2m

£3.9m

£3.1m

£3m

-£733k

-19%

Source: Marine Management Organisation (n.d.)     Note: Values below £10,000 are suppressed


Across England, overall landings are down 8% from 2014. Despite the decline in landings, values have risen by 25% due to the rising price of fish. As a percentage of the total landings in England, the English Solway Firth accounts for 1.9% of the tonnage and 1.5% of the value in 2018. See figures belowTonnage: English Solway Coast as a % of England, 2014 – 2018′ and ‘Value: English Solway Coast as a % of England, 2014 – 2018′.

In terms of individual species, the English Solway Coast accounts for 9% of whelks, 6% of nephrops and 2% of scallops landed in England (by weight).

Tonnage: English Solway Coast as a % of England, 2014 - 2018

Tonnage: English Solway Coast as a % of England, 2014 – 2018. (Source: Marine Management Organisation, n.d.)


Value: English Solway Coast as a % of England, 2014 - 2018

Value: English Solway Coast as a % of England, 2014 – 2018. (Source: Marine Management Organisation, n.d.)


Fish landed in the UK is often exported to foreign markets, mostly to European Union countries (76% of exports). Although data is unavailable for individual species, consultation evidence indicates that much of the shellfish caught in the Solway is exported.

Data is available at the English level, with exports being broadly stable over the last five years. It is notable that fish exports are roughly double the annual fish catch, likely due to exports from English based fish processors (such as Harbourside products discussed in Processing- fisheries and aquaculture) using fish landed or produced in Scotland as inputs, table below.

Fish and Shellfish Exports (Tonnes), 2014 – 2018

Total Production

Tonnage Exported

% Exported

2014

101,211

187,350

185%

2015

101,264

183,505

181%

2016

100,799

186,792

185%

2017

99,555

184,476

185%

2018

92,656

188,070

203%

Source: Marine Management Organisation (n.d.), HMRC


The map below presents a breakdown of the main landing ports on the English Solway Coast, with Whitehaven being by far the biggest and accounting for 79% of landings by tonnage.

Main Landing Ports English Solway Coast, 2018

Main Landing Ports English Solway Coast, 2018. (Source: Marine Management Organisation, n.d.)


The figure directly below, ‘Catch Weight (Tonnes) by Landing Port’, shows the change in catch weight since 2013 by landing port. Catch is down in all ports, with tonnage reductions of 19% in Whitehaven, 50% in Silloth, 49% in Maryport and 99% in Workington.

Catch value in the major ports is also down, but by lower amounts than the catch weight, see ‘Catch Value by Landing Port’ below.

Catch Weight (Tonnes) by Landing Port

Catch Weight (Tonnes) by Landing Port. (Source: Marine Management Organisation, n.d.)


Catch Value by Landing Port

Catch Value by Landing Port. (Source: Marine Management Organisation, n.d.)


The major shellfish species caught in the Solway are not currently subject to EU quotas and therefore little in the way of EU regulation. The exception to this is Nephrops and white fish, however, there is insufficient data at the English Solway geographic area for analysis.

There are, however, minimum catch sizes set for many fish and shellfish species in order to protect the long-term sustainability of species. These are Minimum Conservation Reference Sizes, and the sizes are: 45mm for whelks, 110mm for scallops, 20mm carapace length or 70mm total length for nephrops and 87mm for lobsters.

There are 23 fishing boats currently registered in ports on the English Solway Coast, up one from 2013. Almost half (48%) of these vessels are registered at Whitehaven,  see figures below, ‘Number of Vessels registered in English Solway, 2013 – 2017′ and ‘Number of Vessels by Port in English Solway, 2017’. It should be noted that not all boats registered in the region will fish within the Solway, some will operate outside the Solway Firth, and some of the landings at ports and harbours in the Solway will be made by boats registered outwith the region.

Number of Vessels registered in English Solway, 2013 - 2017

Number of Vessels registered in English Solway, 2013 – 2017. (Source: Marine Management Organisation, n.d.)


Number of Vessels by Port in English Solway, 2017

Number of Vessels by Port in English Solway, 2017. (Source: Marine Management Organisation, n.d.) Note: vessels can be registered at the port/harbour that is nearest to their agent’s office – not necessarily where they operate or land

Sea fisheries

England - Salmon and Trout Fishing

Salmon and trout fishing on the English Solway Coast has experienced a steep decline in recent years, with the total number caught down by 23% since 2014. There has been an even steeper decline over the last ten years, with the total number caught down by 56%, see table below.

English Solway Salmon and Trout Caught (Retained and Released), 2008 – 2017

2008

2009

2010

2011

2012

2013

2014

2015

2016

2017

Change since 2014

% change since 2014

Salmon Number

4,527

3,291

5,040

3,709

2,550

2,175

1,325

1,333

1,714

1,544

-631

-29%

Sea Trout Number

1,978

2,548

2,431

1,735

2,143

1,546

2,225

2,395

2,492

1,335

-211

-14%

Total Number

6,505

5,839

7,471

5,444

4,693

3,721

3,550

3,728

4,206

2,879

-842

-23%

Source: Environment Agency (n.d.)


The figure below, ‘Trout and Salmon by Method, 2013 – 2017’, outlines the numbers of salmon and sea trout caught on the English Solway Coast by method, with declines in both net and rod catches. It should be noted that no distinction is made between retained and released fish, and based upon data from the Scottish Solway Coast, it is likely that the retained catch has decreased more significantly.

Trout and Salmon by Method, 2013 - 2017

Trout and Salmon by Method, 2013 – 2017. (Source: Environment Agency, n.d.)


Consultation evidence indicated that the decline in the catch is due to a reduction in salmon stock and subsequent conservation measures which has limited the number of fish allowed to be caught. The reason behind the decline in salmon stocks is unclear at this stage.


The decline in the fixed engine catch, primarily haaf net fishing, is particularly concerning as this was formerly a viable – albeit small scale, traditional commercial fishery which dates back hundreds of years in the Solway. Haaf net fishing in the Solway at present is a recreational, heritage, and conservation industry rather than a commercial concern.

New fishing byelaws were brought in by the Environment Agency in 2018 for the Solway, border Esk and River Eden effecting haaf net fishing and rod fishing. Net fishing is only licensed for sea trout and salmon in certain estuaries, being prohibited elsewhere. Licence numbers were reduced for the Solway Haaf net fishery to 75 licences (down from 105) (Environment Agency (Limitation of Solway Firth Heave or Haaf Net Fishing Licences) Order 2018). The Solway Firth Heave or Haaf Net Fishing Byelaws provided the following rules;

  • Close period from midnight to 6am daily (previously 10pm to 10am);
  • Mandatory catch and release of all salmon (previous licence conditions allowed each licences to kill 10 salmon);
  • Total of 420 sea trout killed per season, shared amongst licencees;
  • Removal of the weekly close period (Saturday and Sunday). Netting can take place on any day of the week, but only between  6am through to midnight.

Limitations were also placed on rod fishing for the Border Ask and River Eden in 2018;

  • Mandatory catch and release of all salmon;
  • Limit of 4 sea trout per season per angler on the Border Esk;
  • Limit of 2 sea trout per season per angler on the River Eden;
  • Must return all female sea trout caught on or after 10th September up to and including 30th September on the Border Esk and River Eden.

These byelaws are available at the bottom of the Border Esk, River Eden and Solway Firth Net Limitation and Byelaws 2018 consultation page, available here. The measures will be in place for 10 years, until 2028, but will be reviewed in 2023.

Sea fisheries

England - Cockle Fisheries

According to the North Western Inshore Fisheries and Conservation Authority (NWIFCA) the three cockle beds on the English Solway: Middle Bank Cockle Bed, Beckfoot Cockle Bed and Cardurnock Flats Cockle Bed, are all closed under NWIFCA Byelaw 3 Paragraph 12.

There was broad agreement amongst stakeholders that there is a potential opportunity to reopen the cockle fishery in the future, however, Middle Bank Cockle Bed was surveyed with an industry suction dredge in 2017 but there was not sufficient stock to permit harvesting. NWIFCA has plans in place to conduct a survey by hand in 2020 to gauge whether stocks have recovered enough to permit commercial harvesting.


Image; Cockle Shell. © N. Coombey/ Solway Firth Partnership.

Sea fisheries

England - Pressures and Impacts

An assessment of the socio-economic and environmental pressures and impacts of human activity is presented below.

Socio-Economic
Positive Negative
•   Supports rural economy – retaining jobs and people •   Lack of linkages with local supply chains

•   Visual impact on coastal locations


Environmental
Pressure theme Pressure Impact
Habitat damage Habitat damage Subsea infrastructure has the potential to damage the seabed
Dredging for scallops has the potential to harm the seabed
Pollution and chemical Introduction of hazardous substances Potential adverse environmental impact from introducing chemicals into the marine environment
Other physical Marine litter and discarded net, cages, pots, etc. There is a general environmental risk to fish species from discarded nets and marine litter
Biological


Introduction of INNS Organisms present in ballast water and living on ship hulls are just two of many ‘pathways’ by which marine Invasive Non Native Species can be introduced
Bycatch Certain fishing methods run the risk of harming non-targeted fish and shellfish species, marine mammals and seabirds through bycatch

Sea fisheries

England - Regional Look Forward

The sea fishing industry is a small part of the English Solway Coast economy, employing few people and contributing only a small part of regional GVA. However, it does provide valuable employment for local people living in a relatively rural and isolated part of the country.

Brexit is a major concern for the UK fishing industry, as also discussed above within the Scottish regional look forward, with the potential for trade barriers and/or customs checks, which would make exporting logistically more challenging and costly. Other concerns include uncertainty on the:

  • value of the pound making exporting less predictable;
  • future trading relations with the EU and rest of the world once the UK is no longer subject to EU negotiated trade deals;
  • access to important EU fishing grounds; and
  • future quotas and regulation.

It is also worth noting that the NWIFCA as part of of the Science Plan for 2020-2021 in the Tenth Annual Plan, proposes three surveys in the Solway Firth. Silloth sub-tidal mussels, Cumbria mussels (intertidal), and Solway cockles each have surveys proposed through a variety of methods.


Image; Boat on the Solway. © Solway Firth Partnership. Photographer; Colin Tennant

Sea fisheries

References

Baxter, J.M., Boyd, I.L., Cox, M., Donald, A.E., Malcolm, S.J., Miles, H., Miller, B., Moffat, C.F., (Editors), (2011). Scotland’s Marine Atlas: Information for the national marine plan. Marine Scotland, Edinburgh. pp 191. Available here. (Accessed: 22.07.19)

Marine Management Organisation. (n.d). Marine Planning Evidence Base. Available here. (Accessed: 14.05.18)

Marine Scotland (n.d.). Scotland’s National Marine Plan Interactive. Available here. (Accessed: 06.08.19)

Mills, F., Sheridan, S. and Brown S., (2017). Clyde Marine Region Assessment. Clyde Marine Planning Partnership. pp 231, Available here. (Accessed: 14.05.18)


In-Text References;

BBC News (2020). Cockle ‘transplant’ could let Solway beds reopen. Available here. (Accessed: 22.07.20)

BBC News (2015). Council terminates lease for stake nets near Annan. Available here. (Accessed: 08.09.20)

Cappell, R., Robinson, M., Gascoigne, J. and Nimmo, F. (2013). A review of the Scottish Scallop Fishery. Poseidon report to Marine Scotland. Available here. (Accessed: 08.09.20)

Environment Agency (n.d.). Custom data request.

Marine Management Organisation (n.d.). Custom data request.

Marine Scotland. (2019). Scottish sea fisheries statistics 2018. Available here. (Accessed: 08.09.20)

Marine Scotland (2017a). New controls in queen scallop fishery: summary of consultation responses. Available here. (Accessed: 08.09.20)

Marine Scotland (2017b). Scottish sea fisheries statistics 2016. Available here. (Accessed: 08.09.20)

Marine Scotland (n.d.). Custom data request.

Marine Scotland Science (2015). Solway Cockle Fishery Management Study. Available here. (Accessed: 28.07.20)

Office for National Statistics (Various). Annual Business Survey (ABS): custom data request from the ONS & Public data. Available here. (Accessed: 28.07.20)

Office for National Statistics (Various). Business Register and Employment Survey (BRES). Available here. (Accessed: 28.07.20)

Office for National Statistics (2007). Standard Industrial Classification of Economic Activities. Available here. (Accessed: 22.07.20)

Scottish Government (2016). January 2016 Update. Available here. (Accessed: 28.07.20)

Scottish Government (2019). Scottish Annual Business Statistics 2017 (SABS). Available here. (Accessed: 28.07.20)


Image; Scallop fishing boat. © Solway Firth Partnership. Photographer; Colin Tennant