Marine Sector Overview

As mentioned in the overview for the Productive chapter introduction of the Solway Review, this section is populated with data and information from the Socio-economic Assessment’s for the Scottish (SEASS), and English Solway (SEAES), which are two separate projects completed in 2020. Text below will be predominantly directly from the SEASS or SEAES Reports but is altered at times for readability, changes in depicting information or updated information. These reports are available here. These socio-economic reports were needed in light of the changing face of socio-economic aspects impacting the Solway Firth, and also for the purpose of populating the productive chapter of the Solway Review. Text from the SEASS and SEAES reports is not referenced individually.


Image; Scallops and Starfish. © Solway Firth Partnership. Photographer; Colin Tennant

Marine Sector Overview

Scotland

This section presents an economic overview (where data allows) of the marine sector in the Scottish Solway Firth with changes over the last five years across economic indicators presented in the table below. This is based on the core marine sectors of shipping and transport, sea fisheries and aquaculture, and the ancillary marine sectors of fish processing, defence, energy and sport, recreation, and tourism (Please see the Sport, Recreation, and Tourism section for a definition of Sport, Recreation, and Tourism and caveats within the data).

Economic Contribution of the Scottish Solway Firth, 2014 – 2017
Employment Turnover GVA
Total % Change Total % Change Total % Change
Core Marine Sector Activity
Sea Fisheries 45 -25% £4m -11% £2m +1%
Aquaculture 10 -33% n/a n/a n/a n/a
Shipping and Transport 175 -62% £19m -84% £8m -81%
Total Economic Contribution 230 -57% £23m -82% £10m -77%
Ancillary Marine Activity
Fish Processing 425 -62% £144m -12% £37m +12%
Defence 15 0% n/a n/a n/a n/a
Energy 50 +43% £5m +127% £4m +204%
Sport, Recreation, and Tourism 2,500 +7% £70m -16% £30m -13%
Total Economic Contribution 2,990 +7% £219m -18% £70m +3%

Source: Business Register and Employment Survey and Annual Business Survey, Scottish Annual Business Statistics

Note:

1) % change is considered over the period 2014 – 2018 for employment and 2014 – 2017 for GVA and turnover (based on latest available data)

2) GVA and turnover have been uprated to 2017 prices using the GDP Deflator

Across the core marine sectors, there has been a decline in employment across the Scottish Solway over the last five years, in particular there has been a notable decline within shipping and transport employment, likely caused by change in data gathering methodology rather than any real change in activity as outlined in Shipping, Transport and Freight Traffic and seen in the figure below, ‘Scottish Solway: Core Marine Sector Employment, 2009 – 2018’.

Scottish Solway: Core Marine Sector Employment 2009- 2018

Scottish Solway: Core Marine Sector Employment 2009- 2018. (Source: Office for National Statistics (Various) (BRES) and Office for National Statistics (Various) (ABS))


Economic activity in the ancillary sectors is dominated by the Sport, Recreation, and Tourism sector where employment has been broadly stable. The decline in 2018 is due to the closure of Young’s Seafood Pinneys of Scotland site in Annan, leading to some 450 job losses, figure below, ‘Scottish Solway: Ancillary Marine Sector Employment, 2009 – 2018’.

Scottish Solway: Ancillary Marine Sector Employment, 2009 – 2018

Scottish Solway: Ancillary Marine Sector Employment, 2009 – 2018. (Source: Office for National Statistics (Various) (BRES) and Office for National Statistics (Various) (ABS))


Total turnover from core sector marine activities was on an overall upward trend (2009 – 2013), after which there has been a steep decline of almost two-thirds (-63%). As with employment, this likely to be due to a change in data gathering methodology as outlined in Shipping, Transport and Freight Traffic, see figure below, ‘Scottish Solway: Core Marine Sector Turnover, 2009 – 2017’.

Scottish Solway: Core Marine Sector Turnover 2009 - 2017

Scottish Solway: Core Marine Sector Turnover 2009 – 2017. (Source: Scottish Government (2019). Adjusted to 2017 prices)


Across the ancillary marine sectors, turnover has seen steady growth since 2009 driven by increase in both fish processing and tourism. It should be noted that these figures will not include the closure of Pinneys which occurred in 2018 and which will likely have a considerable negative impact when updated figures are published for 2018, see figure below, ‘Scottish Solway: Ancillary Marine Sector Turnover 2009 – 2017’.

Scottish Solway: Ancillary Marine Sector Turnover 2009 - 2017

Scottish Solway: Ancillary Marine Sector Turnover 2009 – 2017. (Source: Scottish Government (2019). Adjusted to 2017 prices)


Annual GVA output from core marine activities was broadly stable up to 2015 when there was sharp reduction, see figure below, ‘Scottish Solway: Core Marine Sector GVA, 2009 – 2017’.

Scottish Solway: Core Marine Sector GVA 2009 - 2017

Scottish Solway: Core Marine Sector GVA 2009 – 2017. (Source: Scottish Government (2019). Adjusted to 2017 prices)


GVA output across the ancillary sectors has followed a similar trend as turnover – a steady increase over time, see figure below, ‘Scottish Solway: Ancillary Marine Sector GVA 2009 – 2017’.

Scottish Solway: Ancillary Marine Sector GVA 2009 - 2017

Scottish Solway: Ancillary Marine Sector GVA 2009 – 2017. (Source: Scottish Government (2019). Adjusted to 2017 prices)


The relationship between turnover and GVA provides a measure of productivity with a high ratio indicating greater productivity. This data, while volatile, indicates an overall increase in productivity likely due to a combination of falling cost of inputs and rising prices for outputs, see figure below, ‘Scottish Solway: Core Marine Sectors GVA to Turnover Ratio 2009 – 2017’.

Scottish Solway: Core Marine Sectors GVA to Turnover Ratio 2009 - 2017

Scottish Solway: Core Marine Sectors GVA to Turnover Ratio 2009 – 2017. (Source: Scottish Government (2019). Adjusted to 2017 prices)


Across the ancillary sectors, the ratio has been on a broad upward trend, indicating growth in productivity driven by the tourism sector, see figure below, ‘Scottish Solway: Ancillary Marine Sector GVA to Turnover Ratio 2009 – 2017’.

Scottish Solway- Ancillary Marine Sectors GVA to Turnover Ratio 2009 - 2017

Scottish Solway: Ancillary Marine Sectors GVA to Turnover Ratio 2009 – 2017. (Source: Scottish Government (2019). Adjusted to 2017 prices)


Marine Sector Overview

England

This section presents an economic overview (where data allows) of the marine sector in the English Solway Firth with changes over the last five years across economic indicators presented in the table below. This is based on the core marine sectors of shipping and transport and sea fisheries, and the ancillary marine sectors of fish processing, defence, energy and sport recreation and tourism. (Please see the Sport, Recreation, and Tourism section for a definition of Sport, Recreation, and Tourism and caveats within the data.)


Economic Contribution of the English Solway Firth, 2014 – 2018
Employment Turnover GVA
Total % Change Total % Change Total % Change
Core Marine Sector Activity
Sea Fisheries 35 +133% £3.4m -34% £1.5m -33%
Shipping and Transport 40 -47% n/a n/a n/a n/a
Total Economic Contribution 75 -17% £3.4m -34% £1.5m -33%
Ancillary Marine Activity
Fish Processing 100 -33% n/a n/a n/a n/a
Defence 175 -22% n/a n/a n/a n/a
Energy 80 +14% n/a n/a n/a n/a
Sport, Recreation, and Tourism 4,245 +2% £148m -23% £53m -5%
Total Economic Contribution  4,600 0% £148m -23% £53m -5%

Source: Office for National Statistics (Various) (BRES) and Office for National Statistics (Various) (ABS)

Note:

GVA and turnover have been uprated to 2018 prices using the GDP Deflator

Across the core marine sectors, there has been an overall decline in employment across the English Solway over the last five years, this has been driven by a decline in Shipping and Transport employment, see figure below, ‘English Solway – Core Marine Sector Employment, 2009-2018’.

English Solway- Core Marine Sector Employment, 2009 - 2018

English Solway- Core Marine Sector Employment, 2009 – 2018. (Source: Office for National Statistics (Various) (BRES) and Office for National Statistics (Various) (ABS))


Employment in the ancillary sector is dominated by the Sport, Recreation, and Tourism sector where employment has been on a slight downward trend, see figure below, ‘English Solway – Ancillary Marine Sector Employment 2009 – 2018’.

English Solway- Ancillary Marine Sector Employment, 2009 - 2018

English Solway- Ancillary Marine Sector Employment, 2009 – 2018. (Source: Office for National Statistics (Various) (BRES) and Office for National Statistics (Various) (ABS))


Total turnover from core marine sector activities has broadly remained stable, with some fluctuations with peaks of just over £5m in 2010 and 2014, see figure below, ‘English Solway – Core Marine Sector Turnover, 2009 – 2018’. The available data for core marine sector activities is from Sea Fisheries – this is discussed in more detail in the Sea Fisheries section.

English Solway- Core Marine Sector Turnover, 2009 - 2018

English Solway- Core Marine Sector Turnover, 2009 – 2018. (Source: Office for National Statistics (Various) (Bespoke). Adjusted to 2018 prices)


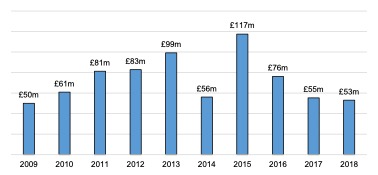
Total turnover from ancillary sector marine activities has been prone to fluctuation, peaking in 2014 and has declined since that time. However, this is entirely down to one sector, which dominates the data: Tourism, Sport and Recreation, see figure below, ‘English Solway – Ancillary Marine Sector Turnover, 2009 – 2018’.

English Solway- Ancillary Marine Sector Turnover, 2009 - 2017

English Solway- Ancillary Marine Sector Turnover, 2009 – 2017. (Source: Office for National Statistics (Various) (Bespoke). Adjusted to 2018 prices)


Annual GVA output from core marine activities was broadly stable over time, albeit with annual variations, with notable spikes in 2010 and 2014, see figure below, ‘English Solway: Core Marine Sector GVA, 2009 – 2018’.

English Solway: Core Marine Sector GVA, 2009 - 2018

English Solway: Core Marine Sector GVA, 2009 – 2018. (Source: Office for National Statistics (Various) (Bespoke). Adjusted to 2018 prices)


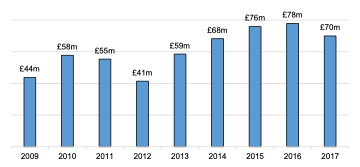
GVA for the ancillary marine sector increased each year to 2013, peaked in 2015, and has experienced a decline in each year since, see figure below, ‘English Solway – Ancillary Marine Sector GVA, 2009 – 2018’.

English Solway- Ancillary Marine Sector GVA, 2009 - 2018

English Solway- Ancillary Marine Sector GVA, 2009 – 2018. (Source: Office for National Statistics (Various) (Bespoke). Adjusted to 2018 prices)


The relationship between turnover and GVA provides a measure of productivity with a high ratio indicating greater productivity. The data indicates that productivity in the core marine sector has been broadly steady, see figure below, ‘English Solway – Core Marine Sector GVA to Turnover Ratio, 2009 – 2018′.

English Solway: Core Marine Sector GVA to Turnover Ratio, 2009 - 2018

English Solway – Core Marine Sector GVA to Turnover Ratio, 2009 – 2018. (Source: Office for National Statistics (Various) (Bespoke). Adjusted to 2018 prices)


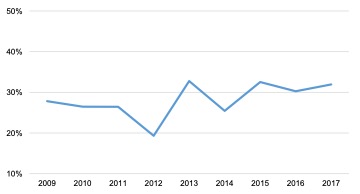
Across the ancillary sectors, the ratio has fluctuated – albeit from a fairly low base, indicating the typically lower value of jobs in the tourism sector, see figure below, ‘English Solway – Ancillary Marine Sector GVA to Turnover Ratio, 2009 – 2018’.

English Solway: Ancillary Marine Sector GVA to Turnover Ratio, 2009 - 2018

English Solway – Ancillary Marine Sector GVA to Turnover Ratio, 2009 – 2018. (Source: Office for National Statistics (Various) (Bespoke). Adjusted to 2018 prices)


Marine Sector Overview

References

Baxter, J.M., Boyd, I.L., Cox, M., Donald, A.E., Malcolm, S.J., Miles, H., Miller, B., Moffat, C.F., (Editors), (2011). Scotland’s Marine Atlas: Information for the national marine plan. Marine Scotland, Edinburgh. pp 191. Available here. (Accessed 22.07.19)

Marine Management Organisation. (n.d). Marine Planning Evidence Base. Available here. (Accessed: 14.05.18)

Marine Scotland (n.d.). Scotland’s National Marine Plan Interactive. Available here. (Accessed: 06.08.19)

Mills, F., Sheridan, S. and Brown S., (2017). Clyde Marine Region Assessment. Clyde Marine Planning Partnership. pp 231, Available here. (Accessed: 14.05.18)


In-Text References;

Office for National Statistics (Various) Annual Business Survey (ABS): custom data request from the ONS (Bespoke) & Public data (ABS). Available here. (Accessed: 28.07.20)

Office for National Statistics (Various) Business Register and Employment Survey (BRES). Available here. (Accessed: 28.07.20)

Scottish Government (2019) Scottish Annual Business Statistics 2017 (SABS). Available here. (Accessed: 28.07.20)


Image; Workington. © Solway Firth Partnership